Case Study •
Tracing Command Chains Through Time & Location
introduction • process • unique problems • learnings
Using novel technology to analyze groundbreaking chain of command research
Under Whose Command, a new platform for command chain analysis in Myanmar, is the culmination of a year–long collaboration between DOT • STUDIO (our agency) and Tony Wilson and Tom Longley at Security Force Monitor (SFM) — an NGO situated at the Human Rights Institute, Columbia Law School.
The project addresses a difficult but critical problem: military command structures are fluid, making it challenging to determine who was in charge at a specific time and location. Meanwhile, identifying perpetrators and commanders has historically been key to pursuing justice, notably since the Nuremberg Trials, where establishing command responsibility played a pivotal role in prosecuting war crimes.
Using SFM’s cutting–edge research techniques and our expertise in handling complex, deeply–linked data, the team built a logic system that could map these command hierarchies with precision — making it easier for journalists, courts, and researchers to connect commanders to their subordinates’ actions.
We worked closely with SFM’s research team to create workflows that integrate with existing research habits. Together, we re–developed the data format and domain logic to fit both the ergonomics of existing research tools and to allow for easy analysis. We also created data validation and management platforms, along with a website that exposes command chains of over 1000 alleged incidents in Myanmar — Under Whose Command. DOT • STUDIO and SFM continue their collaboration to this day.
Under Whose Command garnered the press attention of The Guardian, AP, Al Jazeera, and many others.
How We Did It
introduction • process • unique problems • learnings
 A whiteboard from a brainstorming session – one of many.
Researching Workflows & Pre–Existing Knowledge
Before our involvement, SFM already operated one of the most advanced research and analysis programs in the human rights field. They had deep expertise in spreadsheet design, data analysis, GIS, data pipelines, and data extraction. In collaboration with DataMade, SFM had already created Who Was in Command, as well as a training database. They were able to publish their datasets to their stakeholders in usable ways.
We were brought in to answer a new set of analytical questions that existing tools and data formats could not yet answer, and to draw on existing knowledge to build new systems. Specifically, retaining field–based sourcing, and precise command chain analysis were open needs.
Our expertise in domain modeling, data transformation, interfaces, and web technologies enabled us to develop a suite of backroom tools for validating and investigating the data. Additionally, we created capabilities to publish analyses in products like Under Whose Command.
1 Training a small team to use Google Sheets is often much less expensive than creating custom editing software – a huge project on its own. To be considered a replacement, such a tool would have to offer: real time collaboration, comments, fine–grained field based permission, custom workflow creation, access control and sharing, exports, filters, pivots, views on large data — and much more.
2 Often, NGOs are required to put their data into software systems where they become reliant on that system for use of the data. These foreign systems often run out of funding, have inflexible data formats or are incompatible with other necessary tooling.
Early on, we recognized that given the team’s comfort with complex spreadsheet functionalities, as well as the numerous advantages of such a tool1, a spreadsheet–based approach would be the most effective solution. The in–sheet data would continue to be considered the primary source of truth — our tools would then draw from this data to perform analysis. Given the nature of nonprofit funding, this would allow SFM to retain sovereignty2 over their data, even in the case that no one could maintain the software or databases any more. Instead of custom data entry software, we built the tooling to integrate around existing workflows and skills, putting the efforts into data extraction.
Choosing the Right Tools
3 A flexible database design approach where data is stored in a highly generic structure, with entities representing objects, attributes defining properties, and values holding the associated data, making it ideal for handling diverse and dynamic datasets.
4 Command hierarchies form a graph datatype, not a tree datatype – more complicated than trees in almost every way: please see Unique Problem #1 for more information.
5 A fact, allegation, small piece of information. For example, two separate publications may refer to the same person with two separate names. Source A might assert a person’s name as Bob, while Source B asserts it as Robert. Both citations and their sources must be preserved.
To accomplish the analysis and overcome unique challenges identified, we leaned on our knowledge of Entity–Attribute–Value (EAV) data modeling3, graphs, and PostGIS. The cyclic, directed graph nature of the project4, as well as the assertion–based claim structure of the data model5, informed the choice of Datalog (Datomic, DataScript) databases in combination with GIS mapping systems to aid the research team and publish complex data in simple and understandable ways. We conducted research and prototyping to inform these decisions, testing RDMS systems, NoSQL databases, and Neo4J. Starting with analysis questions and a sample dataset, we built prototypes in various systems to evaluate their strengths and weaknesses.
6 In the family of LISP languages, Clojure offers a massive amount of functional tools for dealing with data. Additionally, it has strengths in the web stack, allowing the speedy creation of prototypes without unnecessary boilerplate. Being able to create fast server libraries in Java and usable frontend interfaces in JavaScript from the same codebase was a huge advantage.
7 A subset of Prolog, and conceived almost 50 years ago, Datalog offers an alternative to SQL for querying data, using declarative logic programming. SPARQL in the RDF world is quite similar to it, and allows rule–based querying over entity facts. Rules about how data relates can be created, that offer a simpler solution than CTEs or complicated JOINs. These databases allowed us to create elegant and reusable queries, saving us much custom recursive code we would have had to write with SQL.
Choosing Clojure6 and Datalog7 was a calculated risk–but one which paid off. The Datalog model offered the simplest and most ergonomic queries, had strengths in graphs and relationships, and the entity model could easily transform to more standard formats. In–memory Datomic was chosen on the server, allowing complicated relational rule–based queries to map over tens of thousands of claims, linking sources to the attributes of entities. Using Clojure allowed for rapid prototyping and fast feedback cycles. Together, this allowed constructing arbitrary graph traversal queries, without having to round–trip from the database to execute recursive code, allowing the nature of traversing the domain model to be separated from the specifics of the relationship. How entities relate, and how relations work through time, could be developed as separate concepts. Using Datalog queries, it was possible to get every subordinate, as well as the time ranges they held true for, with a simple query like (subordinate-of ?a ?b ?start-date ?end-date)
DataScript, a database which can be run in the browser, was used in Under Whose Command to generate a static website based off of the same queries used in the backend tooling. Put in other words: a copy of the database can be shipped and used to create the frontend.
Development Workflows & Outputs
We developed tools in close collaboration with the research team, ensuring their direct involvement throughout the process. We were able to implement changes quickly, and the tooling evolved in tandem with evolutions of the data model as well as ongoing research. As new needs were discovered, they were discussed, mapped, and implemented in the tooling.
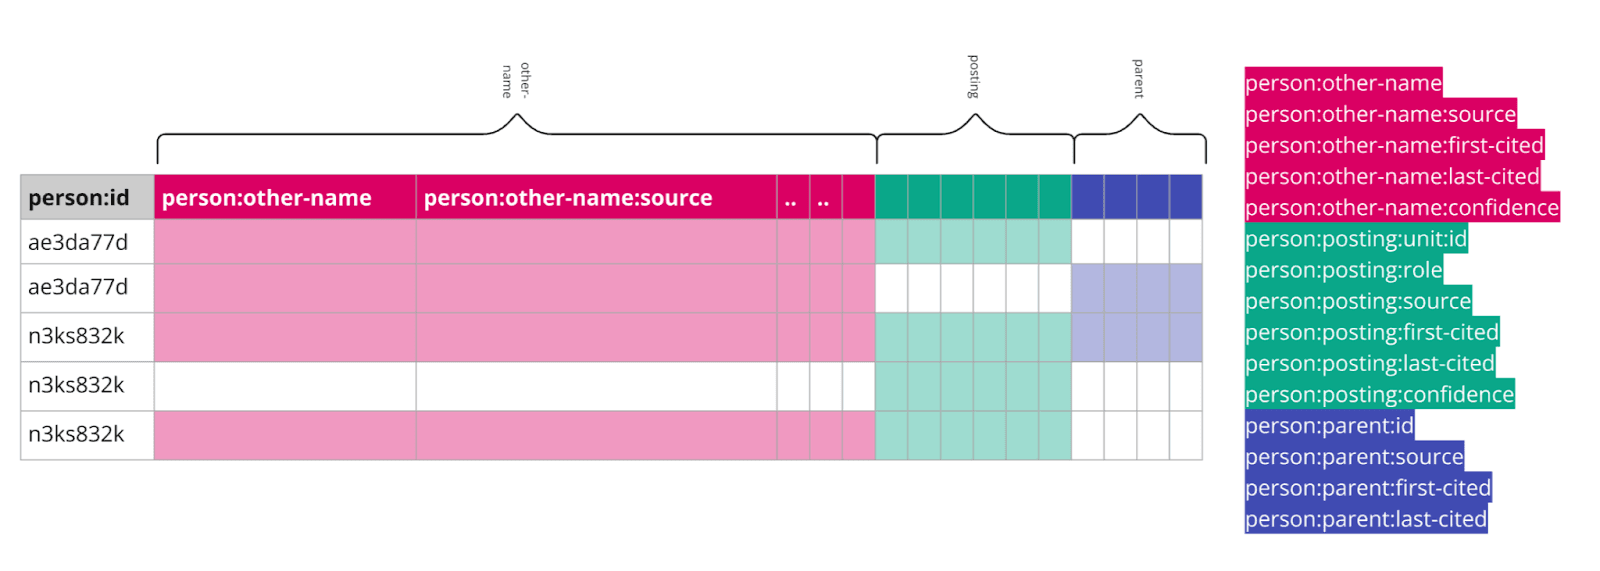
A visualisation of how data was extracted from existing sheets to create entities.
Developing a Data Model
In the first development phase, we focused on extracting parseable data from existing datasets. In many cases, systems were developed to extract multiple entities from single rows of data and later de–duplicated them.
We then used this data as a basis for creating new avenues for analysis, shining light on its strengths and weaknesses. We developed a new format of the Domain Model that would work for both developed tooling and the research team.
We wrote data transformation scripts, so that DOT • STUDIO’s tools could accept data in multiple formats (old spreadsheet versions, new formats, JSON, CSV, SQL) and from multiple sources, combining them into consistent outputs.
They relied on bidirectional data transformations, leveraging a high–fidelity data model developed with insights from EAV and knowledge graphs. This model enabled them to express the same data in a relational format, a document model, or as rows.
To ensure that SFM would not be stuck with a proprietary model, DOT • STUDIO created exports to CSV, JSON, EDN, and SQL.
Research Software
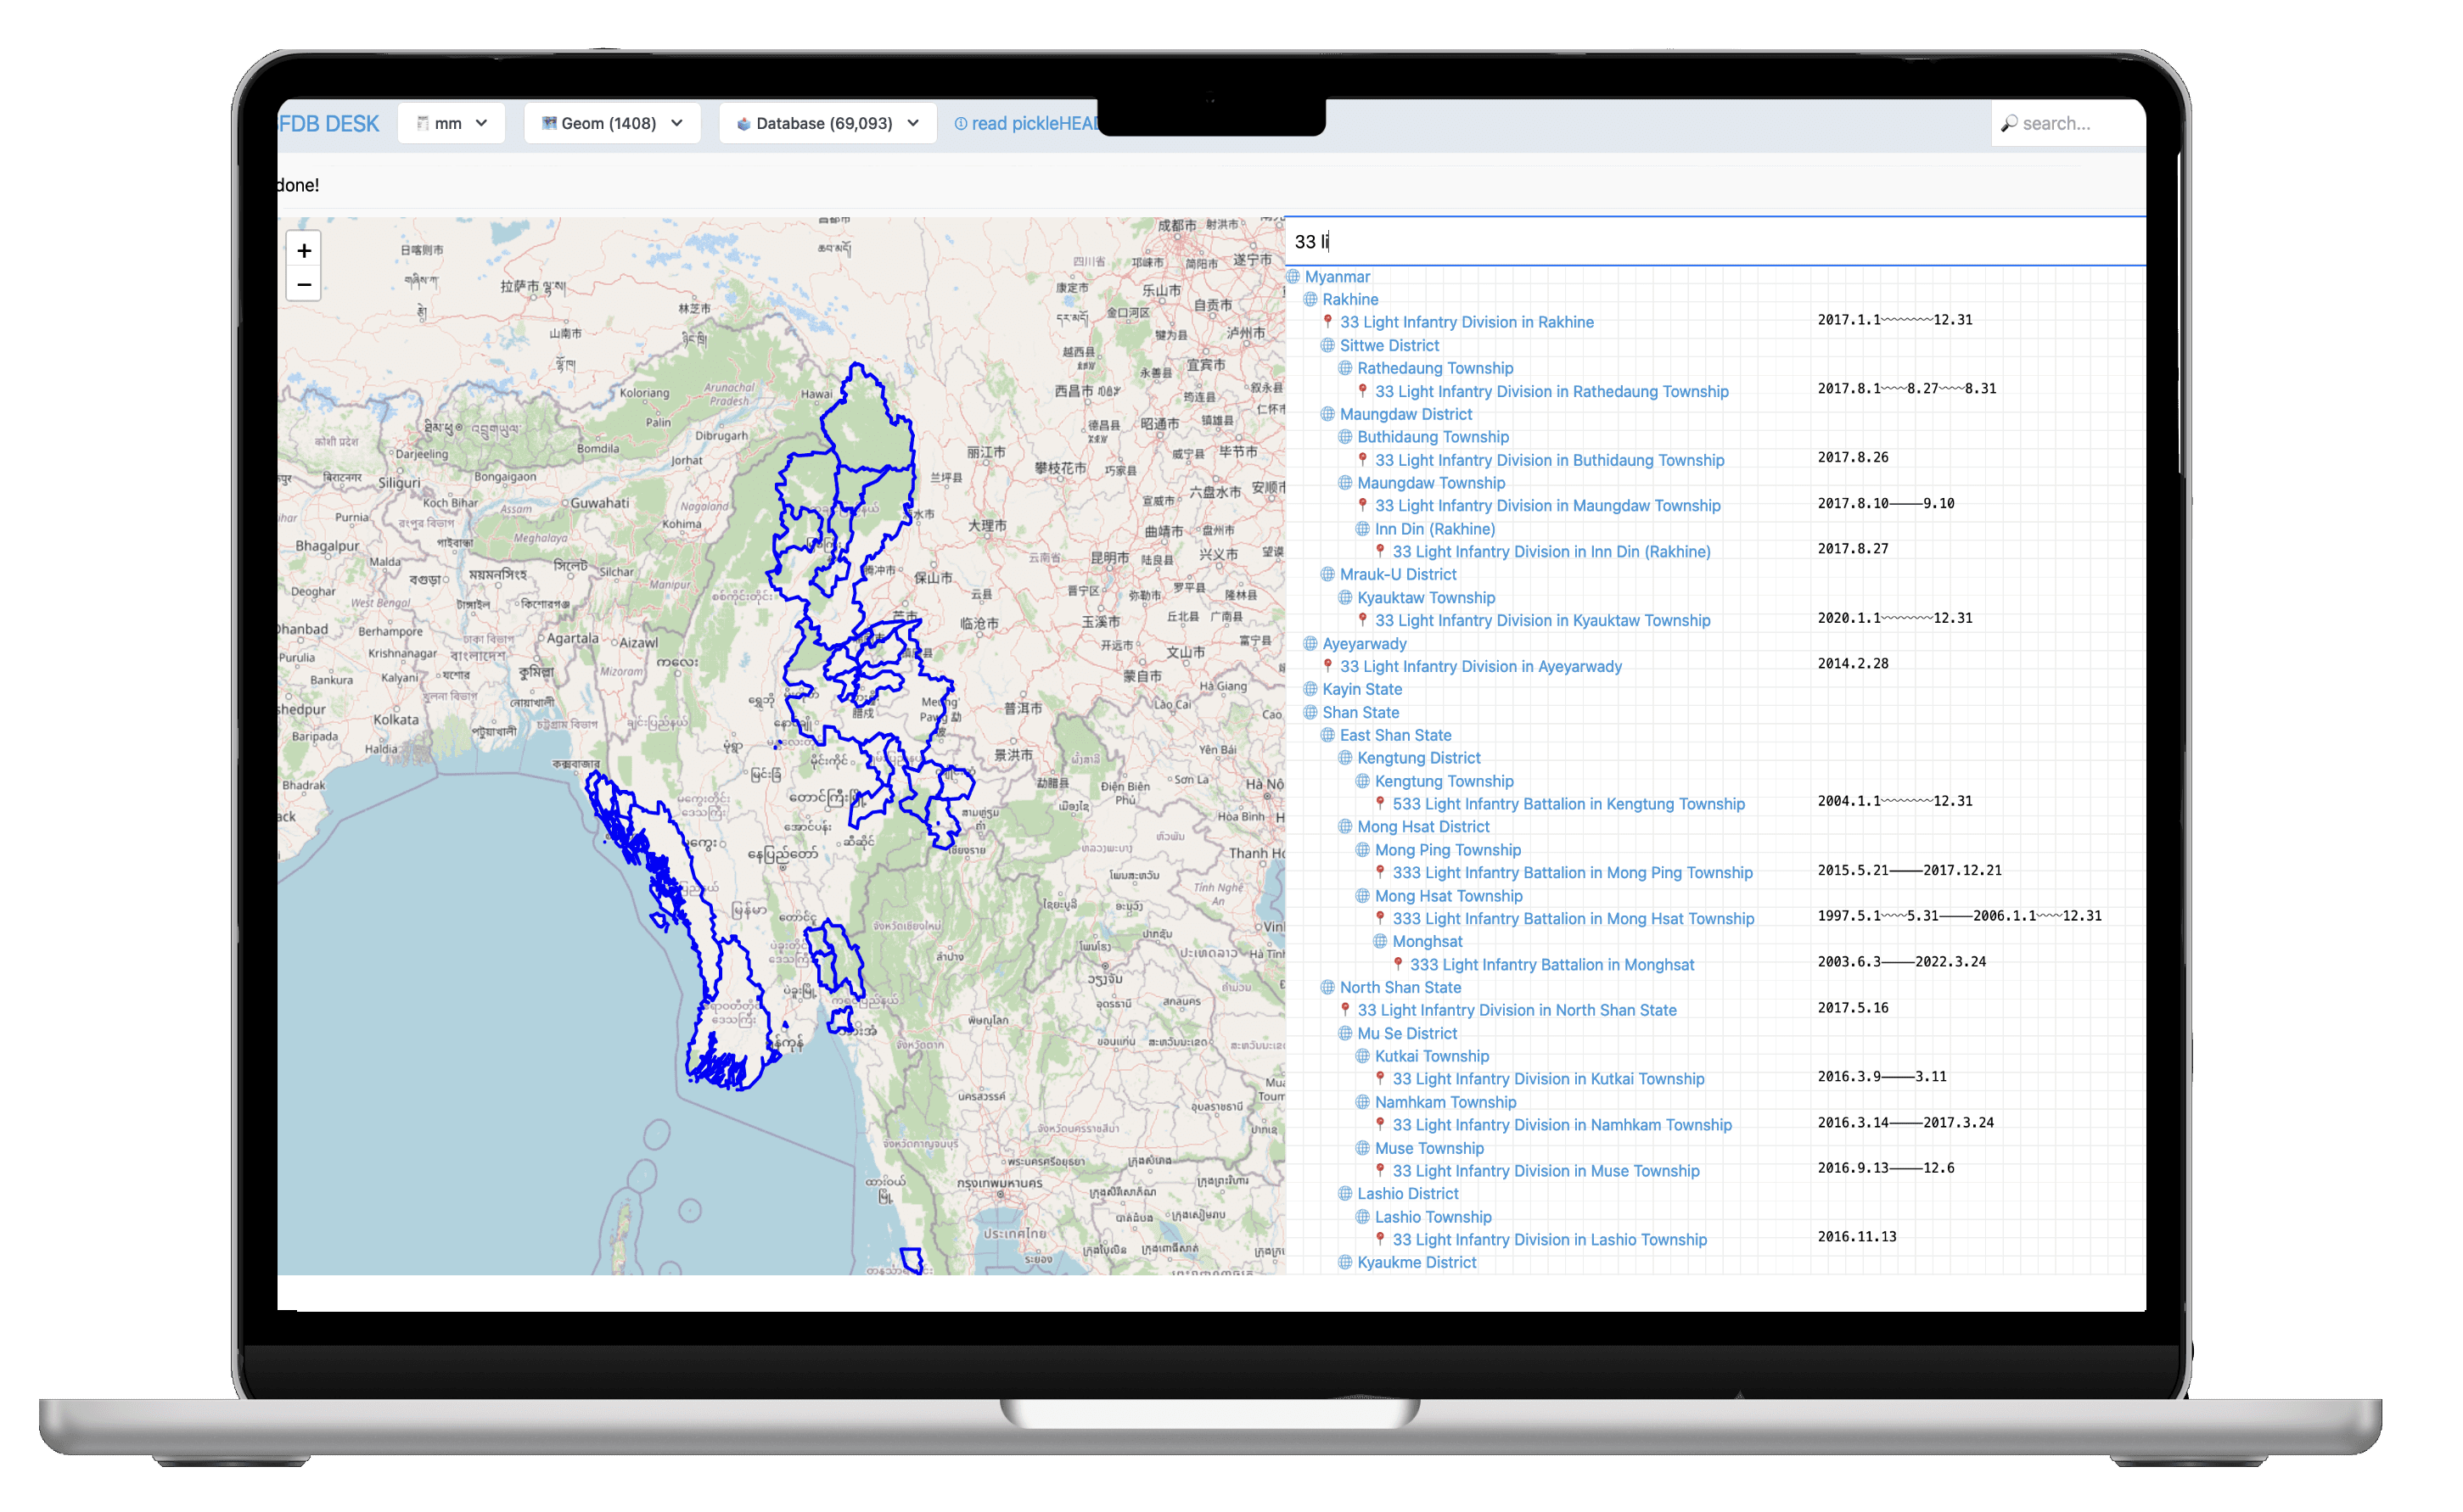
Where & When: One of the views in the research tooling which allows the researchers to immediately search all units and their locations — as well as when they were there.
DOT • STUDIO created an internal tooling application allowing access to views, search and analysis on the fly. For example, as pictured, mapping the entire dataset’s units and their locations was constructed on a map dynamically, allowing the user to search, filter, and hone in on information — seeing the hierarchies along the way.
Additionally, the tooling provides data validations, explanations for data integrity issues, graph meta analysis and querying. It also simplifies exports to partners. This tool was built in full–stack Clojure, using Reagent in the frontend. To keep the tool dynamic and fast, messages and queries are sent over a WebSocket between the server and the client, allowing dynamic queries to be served faster, and allowing researchers to collaborate in real time. We created further tooling to keep data from OpenStreeMap and other open APIs up to date with the research dataset. To show how geographical positionings affect numbers in the analysis, we displayed maps using both OpenLayers and Leaflet.
To empower the research team with greater autonomy and efficiency in their work, we ensured that changes were continuously deployed and made accessible on a web server. All visualizations showing graphs, times, and sources can be regenerated programmatically by the research team, without needing to contact a developer. This allows the research team to create datasets at their own pace. To reduce hosting costs and increase sustainability, we utilized Fly.io machines, which can shut down when not in use — enabling powerful analysis machines to be used — on call.
8 Since data changes are rare for a published dataset, we see no reason to maintain an active–process database for published data. We can always re–build the site in the event of a data change, and look at it as a one way pipeline. This reduces maintenance cost and effort significantly. Running the database in the frontend would allow for things like a search, despite the static build of the site without running server infrastructure.
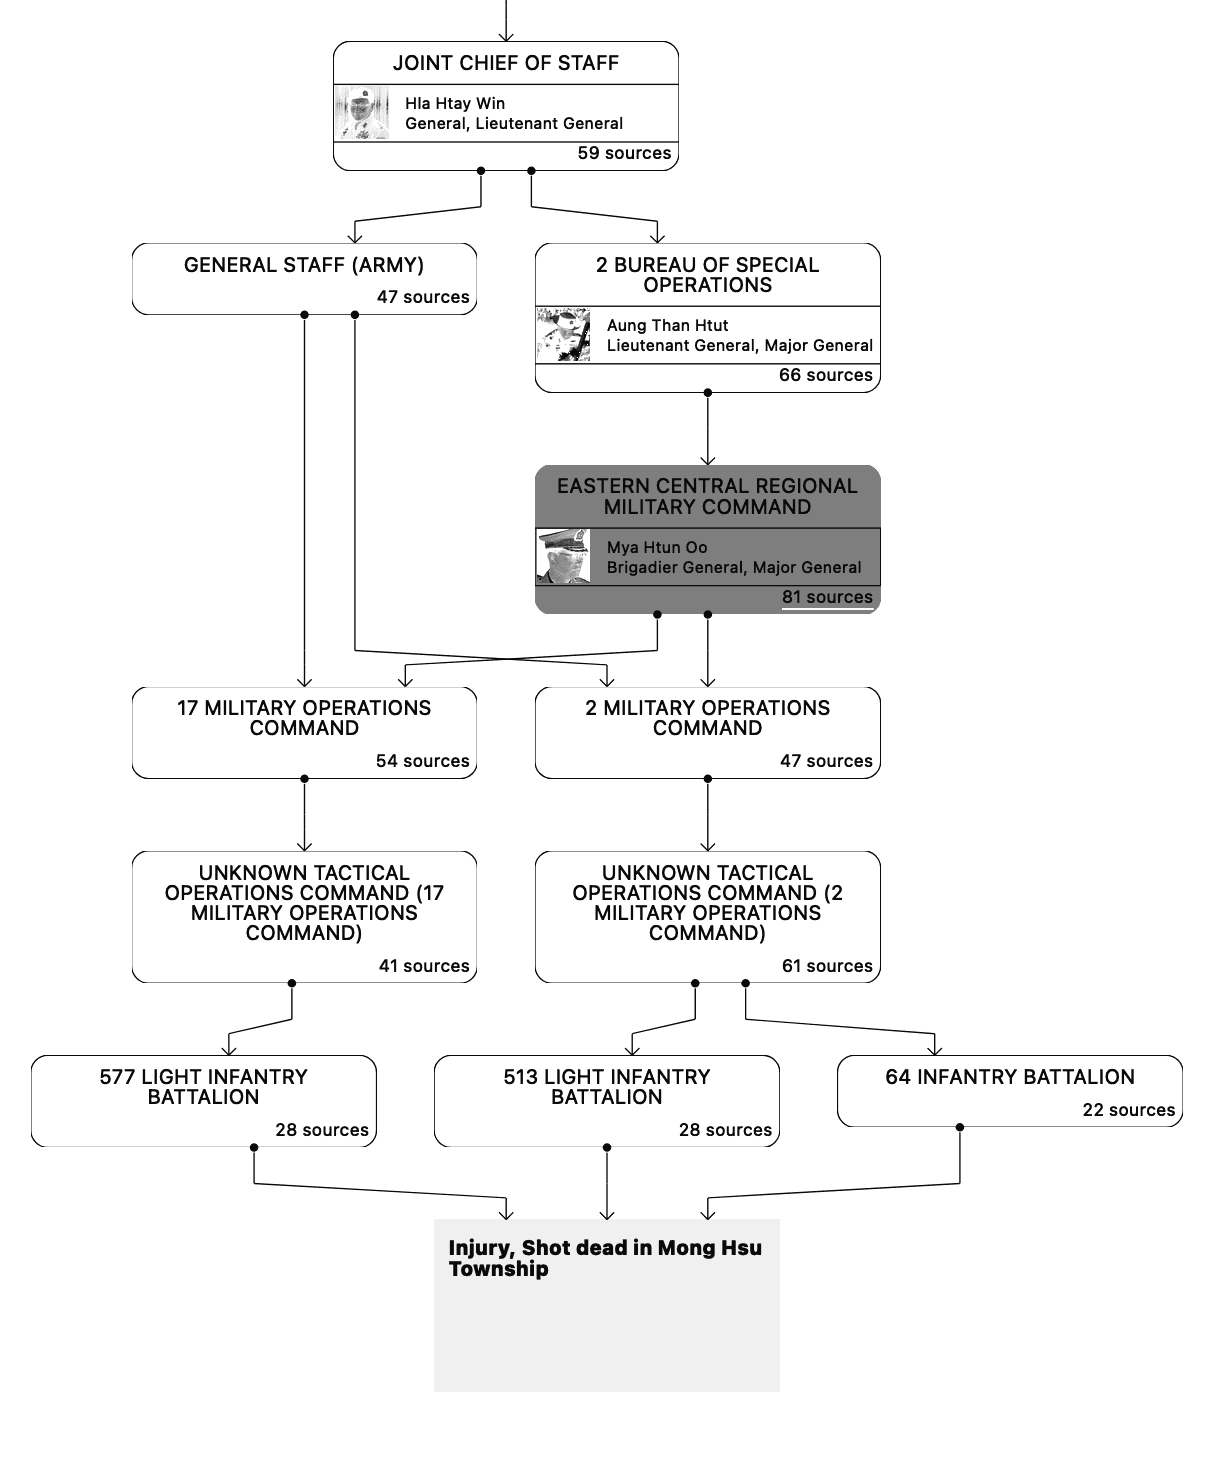
The application required the creation of a custom graph visualisation library
Data Publishing Platform: Under Whose Command
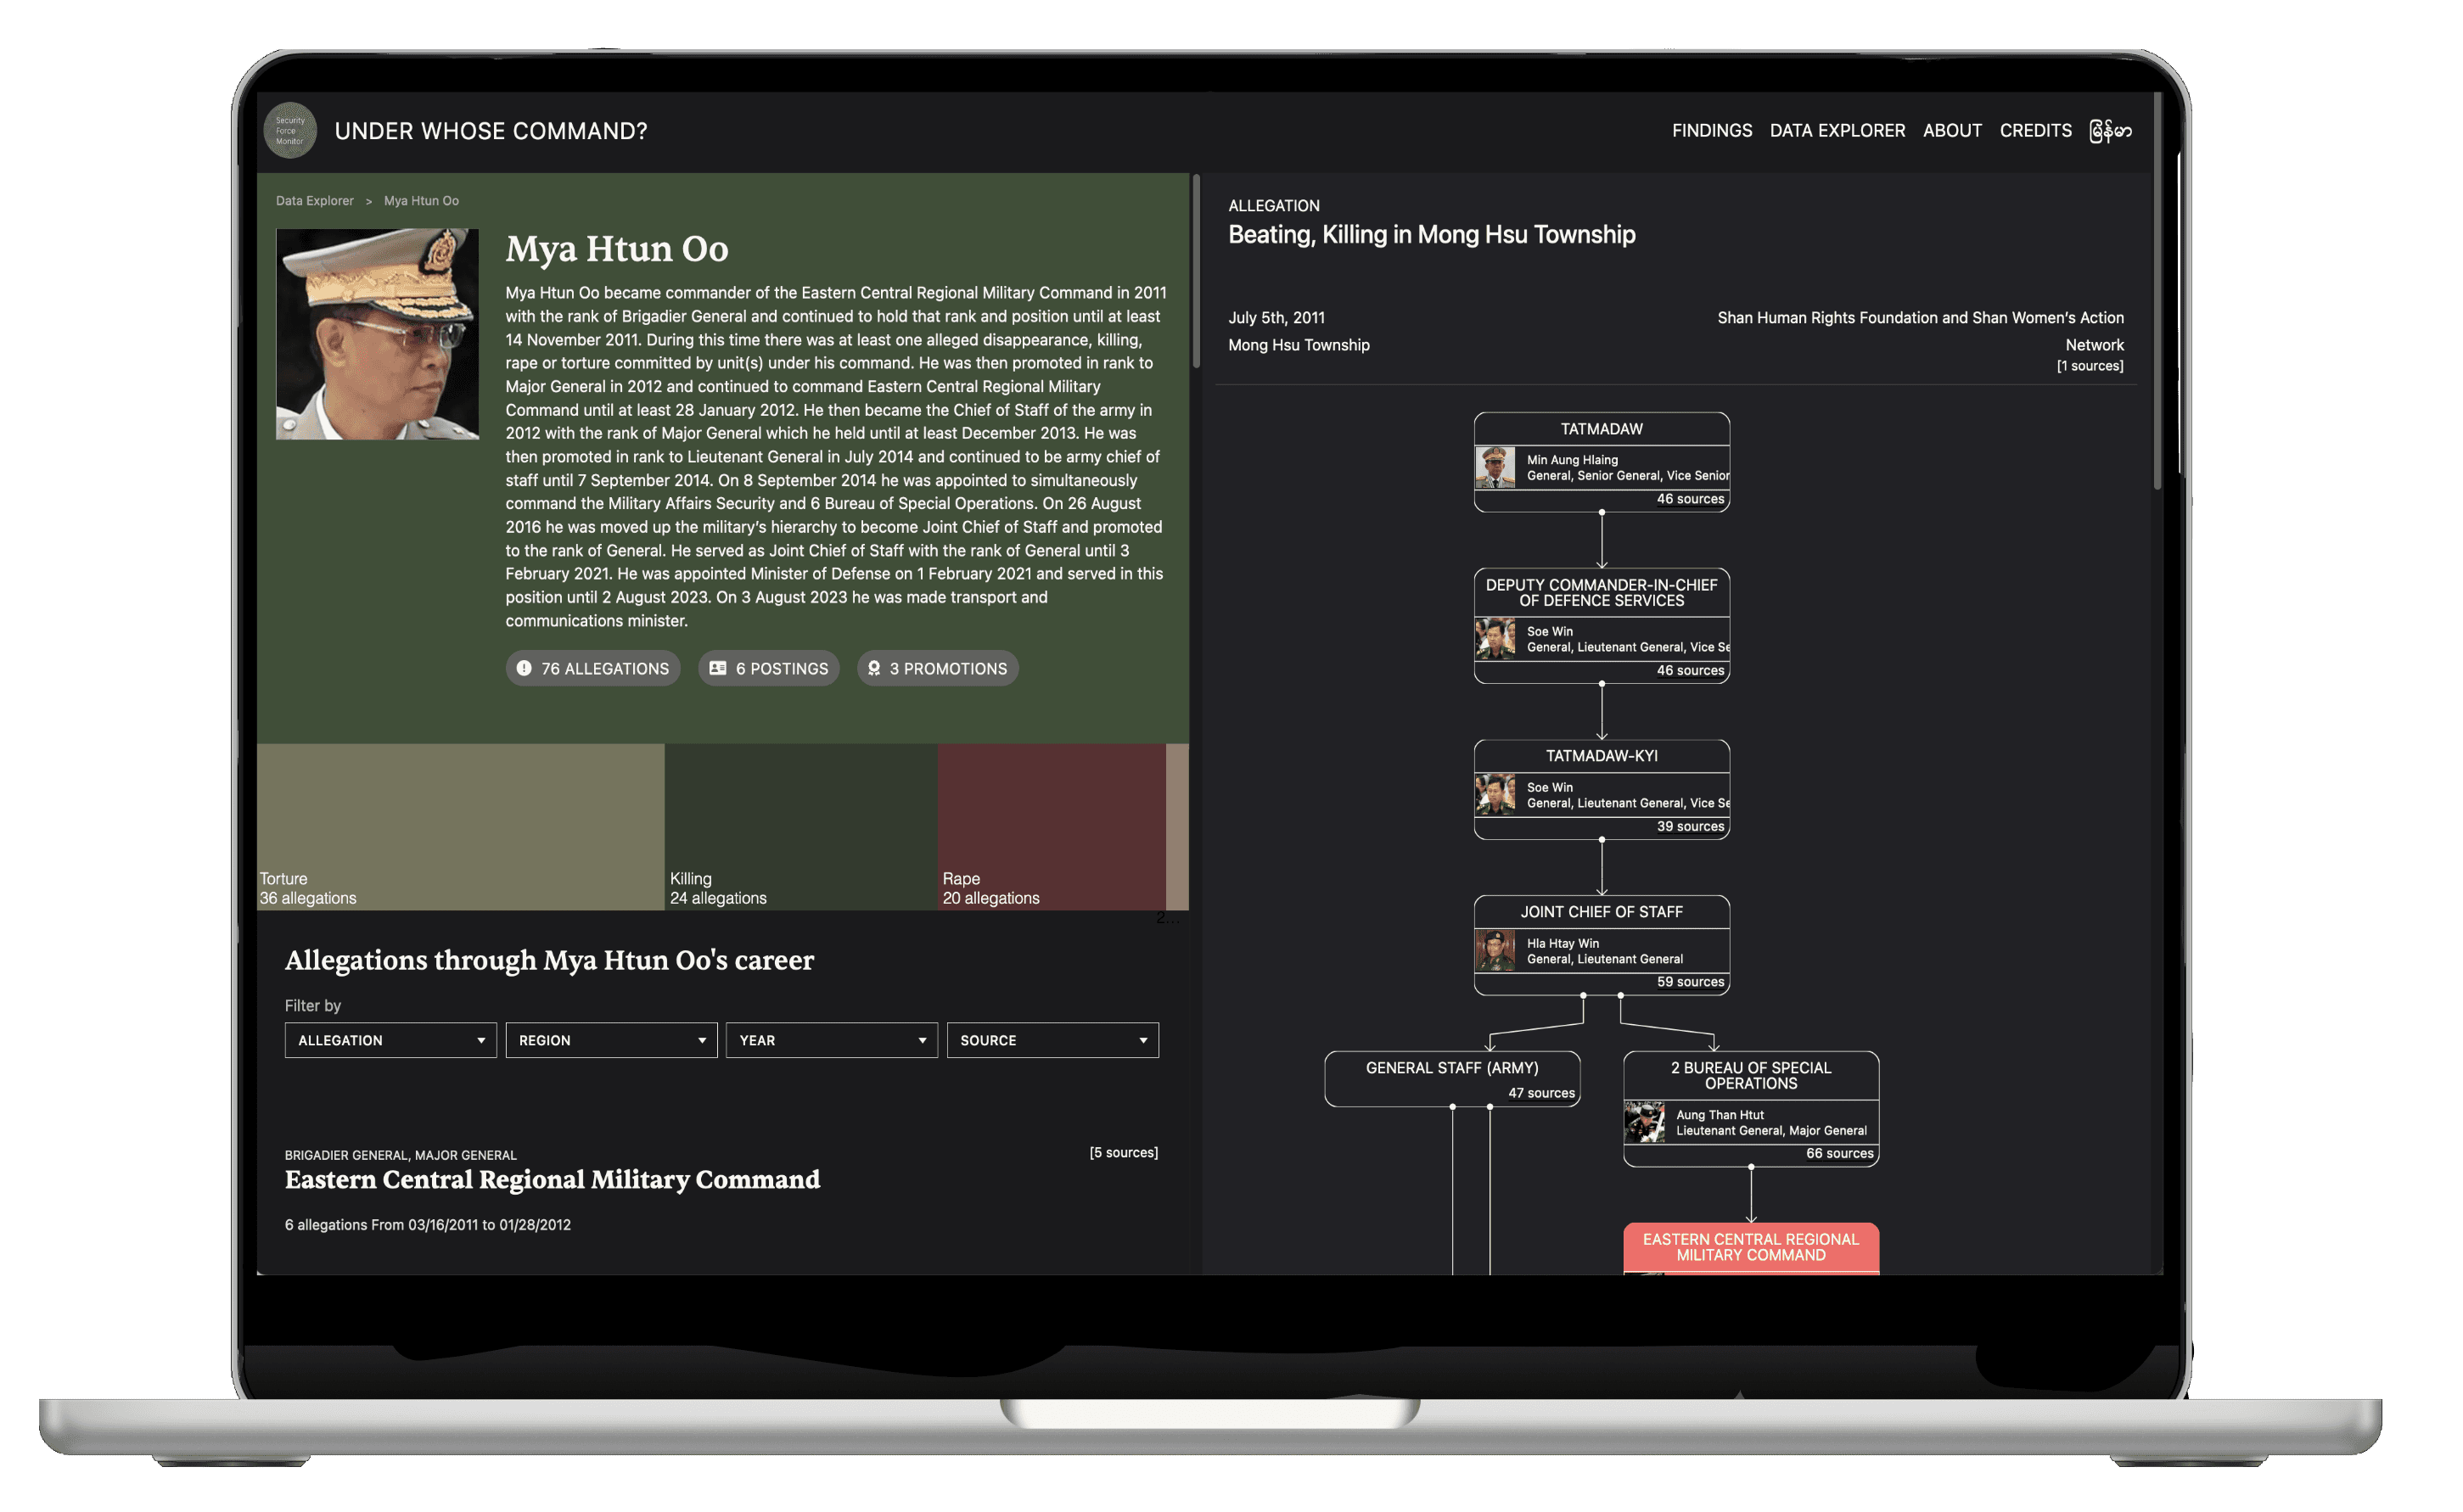
SFM and DOT • STUDIO released an online platform highlighting allegations of war crimes in Myanmar. The platform’s Data Explorer releases all of SFM’s data on commanders, units, and chains of command, in a user friendly and researched way — making this data — and its sourcing — available to lawyers, journalists, and activists. The platform includes an in–depth methodology page, explaining how the data can dynamically construct sourced, time–based command chains.
In collaboration Cecilia Palmér, di:ga and DataMade, we did comprehensive user studies, wireframing iterations, design phases, and project planning. DOT • STUDIO took the role of lead technology architects and designed a system that would be quick to develop, easy to publish, and run sustainably — with little maintenance in the future. A static site was generated8 off of a snapshot of SFM data.
Since Clojure and Datalog are available both on the backend (compiled to Java) and the frontend (compiled to JavaScript) — we were able to use DataScript on the frontend instead of Datomic, with a subset of the data from the research tooling. This made all of the existing queries and data–access devices available in JavaScript as well. Additionally, it allowed us to collaborate in development using Next.js — as more developers are proficient in JavaScript. Using this combination resulted in a fast development time, as it used the strengths of each platform.
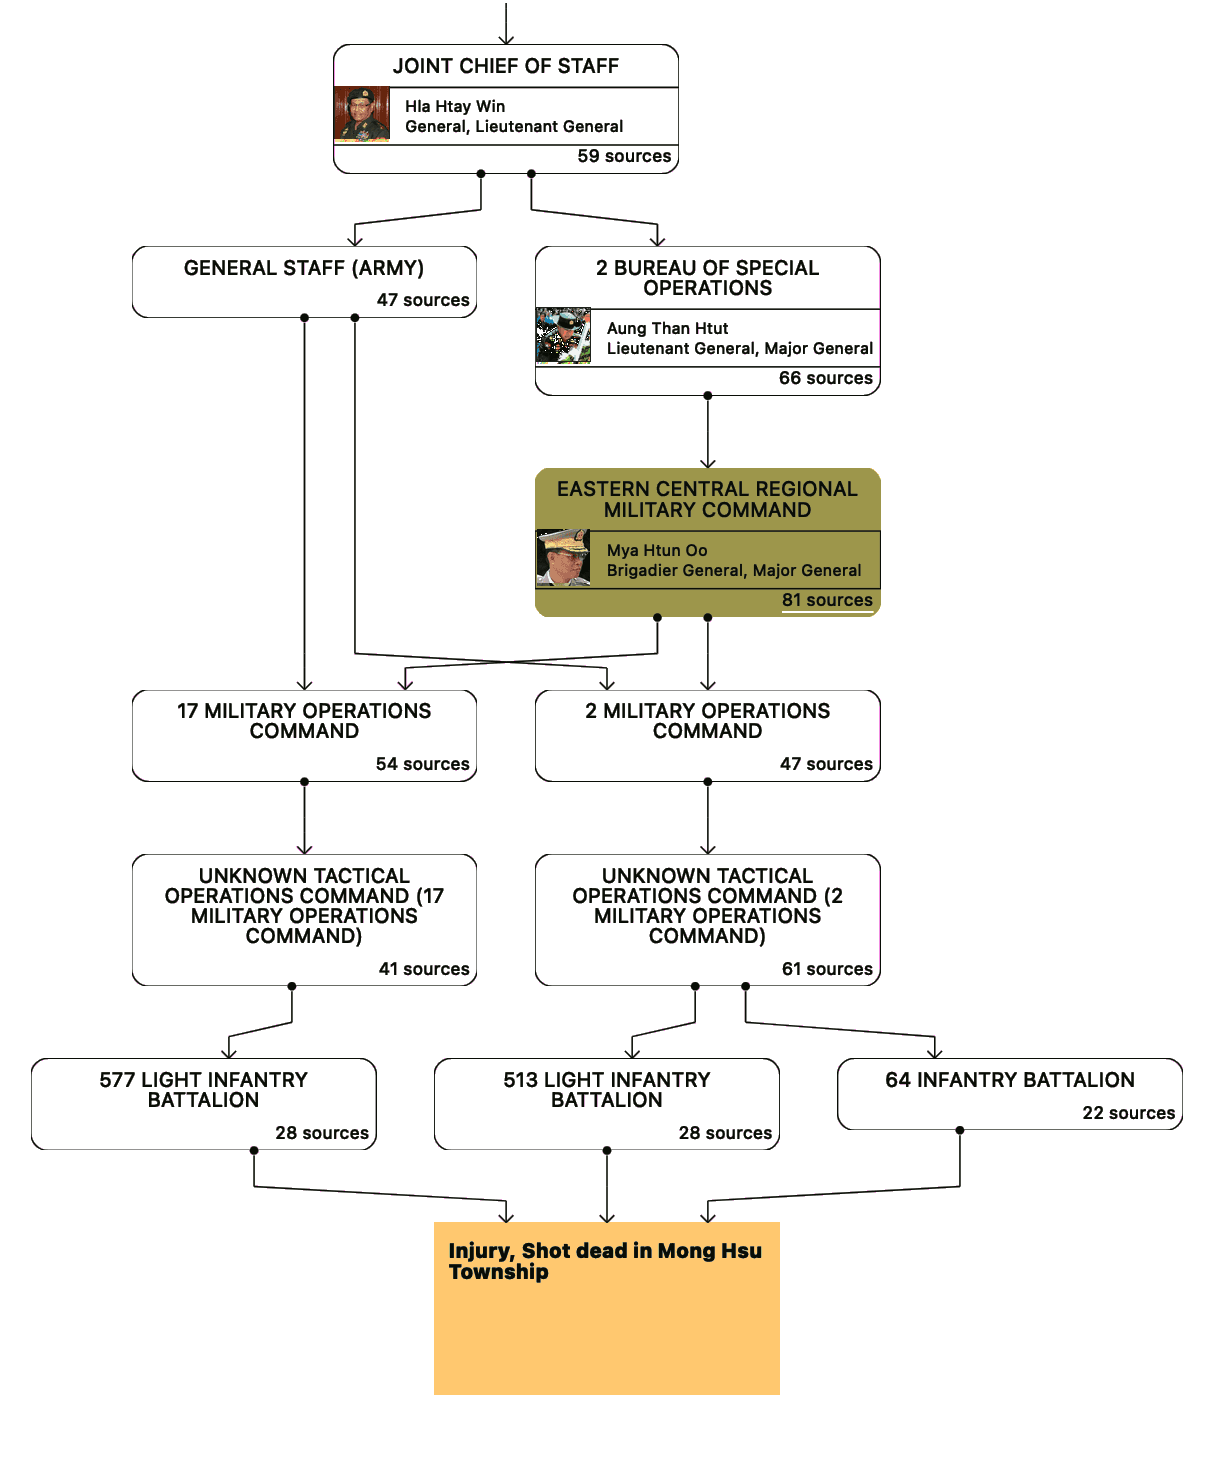
Additionally — in regards to the visualization of the command chains — we enacted a period of technical research, to see prior work on org–chart and visualisation libraries. It became clear that existing libraries were inadequate for displaying this sort of graphed command chains. These tools often failed to effectively represent hierarchy within a graph, especially when dealing with multiple parents or branching paths. To address this limitation, we implemented a custom solution capable of visualizing graphs with implied hierarchy, even in the case of multiple parents or branching paths. The result, as shown in the accompanying example, allows arbitrary graphs with branching paths and multiple parents to be rendered programmatically as SVG.
This work resulted in a unique and comprehensive application on the Tatmadaw — Myanmar’s military. It was received well by the target audiences, and we are happy to have helped publish one of the most comprehensive views on the topic.
Command Graphs: Unique Problems
introduction • process • unique problems • learnings
The following sections explore three critical challenges addressed by the project: (i) the dynamic and often overlapping nature of military chains of command and their geographical contexts, (ii) the inherent temporal uncertainty in source data and the need to infer time ranges accurately, and (iii) the imperative to retain precise sourcing for every individual claim to ensure transparency and accountability in future analysis.
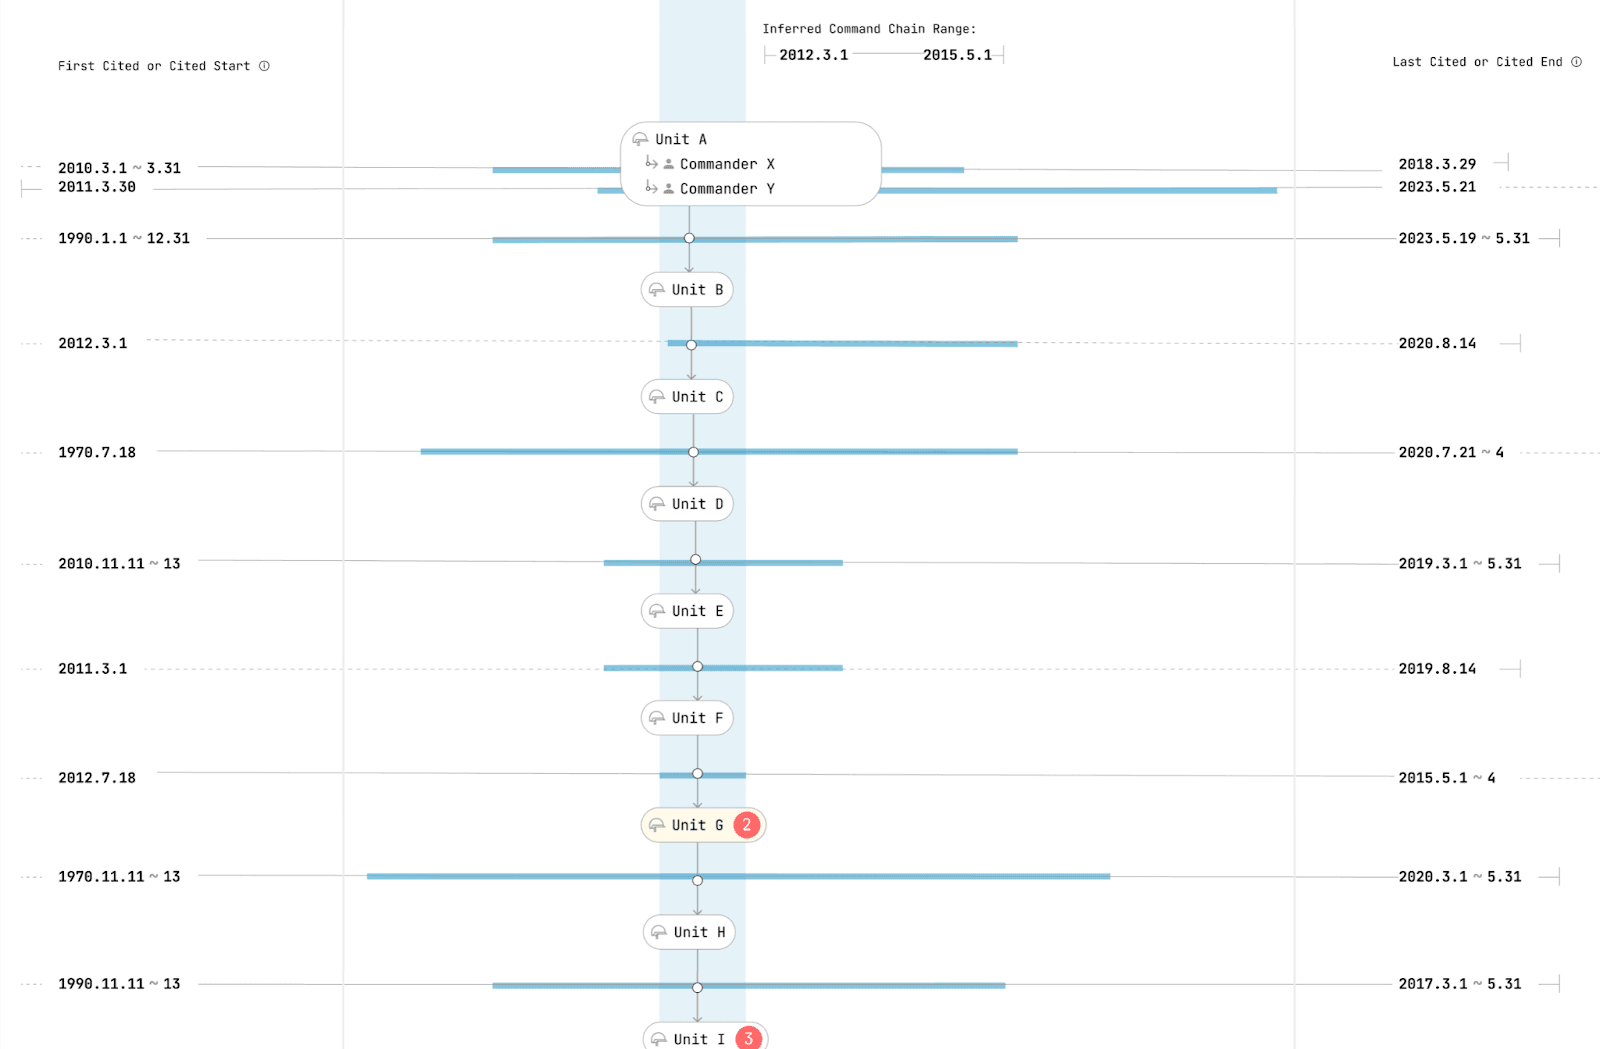
9 Chains of command form a Temporal Hierarchy. If commander A commands B from time X→Y, and commander B commands C from time period N→M, then A only commands C from the intersection of X→Y and M→N, if such an intersection even exists. Simply because a commander was higher in the hierarchy does not mean an unbroken chain of command can be found.
Problem • 1Command Chains Change Over Time
Command chains are dynamic, evolving over time as unit relationships, locations, and hierarchies change. This complexity is amplified by the fact that locations have their own shifting administrative geographies, and relationships between units form intricate, cyclic graphs rather than static trees.
The attached illustration visualizes how DOT • STUDIO’s system creates paths in the command chain that exist for particular time periods9. By using the time periods of relationships between units, we can analyze and reveal unique paths, tracing connections from a subordinate unit to a superior unit or commander.
The problem also grows in complexity when we add the concept of locations and geography: A unit is sometimes only present in a location for a period of time. This location is nested within larger areas (districts, regions), that have their own command hierarchies. Additionally, the administrative geographies and geometries of locations might change throughout time. East Germany, for example, only existed for a particular period of time, and changed shape during its existence.
The problem is further complicated by the fact that command chains and the relationships between units do not follow a tree–like structure, making it impossible to represent them in a static way. Due to their changing nature over time — but also because of the messiness of the real world — these relationships form a graph instead of a tree. And not just any graph, but a directed cyclic graph: Soe Win, a commander in Myanmar’s Tatmadaw, held two simultaneous positions, technically making him his own commander.
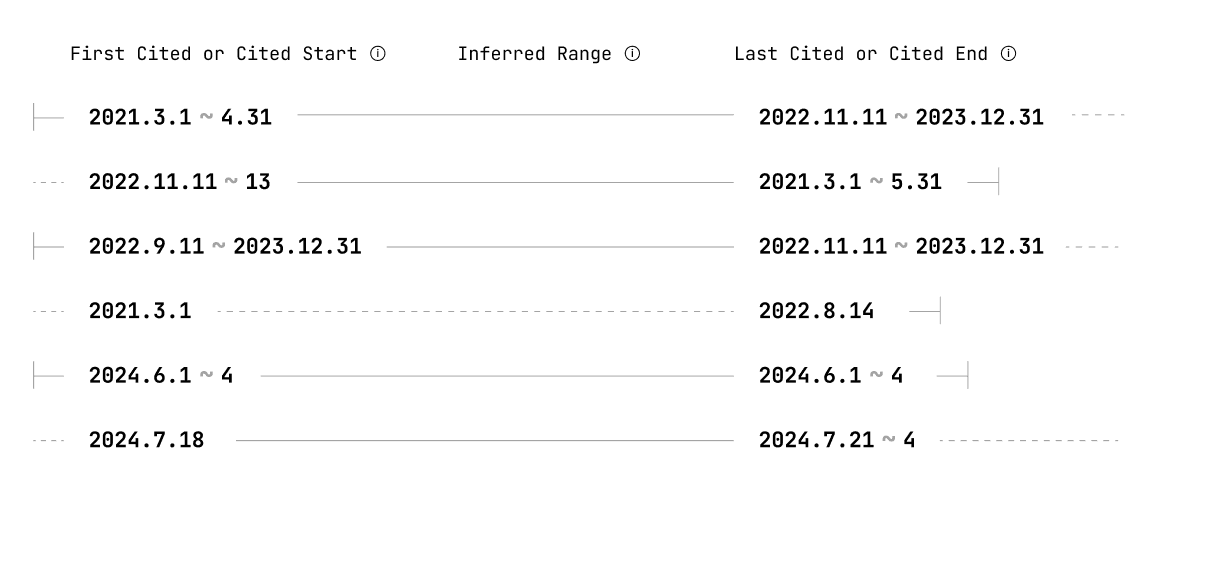
11 Everything inside the domain has a time range. A relationship between units, the unit itself, a person, or a location. A birth of a person implies a beginning. An article about a person in a position implies the person held that position at that point in time, but does not imply a beginning or an ending. Some things, like concepts, or towns, may exist from the beginning of time until the end of time.
Problem • 2Sources Express Time Ranges Imprecisely
SFM’s data relies entirely on media, government, and academic sources, which introduces a challenge in the form of temporal uncertainty. A source may claim that a commander was seen leading a unit in January 2019. This assertion contains a degree of uncertainty: we know that it holds true for some days in January 2019, but asking if the commander was in charge on any specific day should include our uncertainty. We know the commander started in January, but we don’t know if it was the 12th, the 18th, or the 31st. Using inference, we are able to record that, according to the source, the commander was in command after January 2019. If we ask who was in command of the unit on February 2, we can say that we have a source, that through inference, claims this.
Some sources claim the beginning of something11, some claim simply something existed, and some claim the end of that. Using multiple sources together, SFM is able to automatically infer time ranges. These time ranges include the precise range – in which all days imply existence, and the imprecise range — in which some days may hold true. How these ranges work is further explained in SFM’s findings.
If a unit is seen in a location many times over a certain time period, SFM can infer that unit’s continuous deployment there. Analysis can be performed on these ranges12. Ranges are expressed, and used in analysis, including their uncertainty.
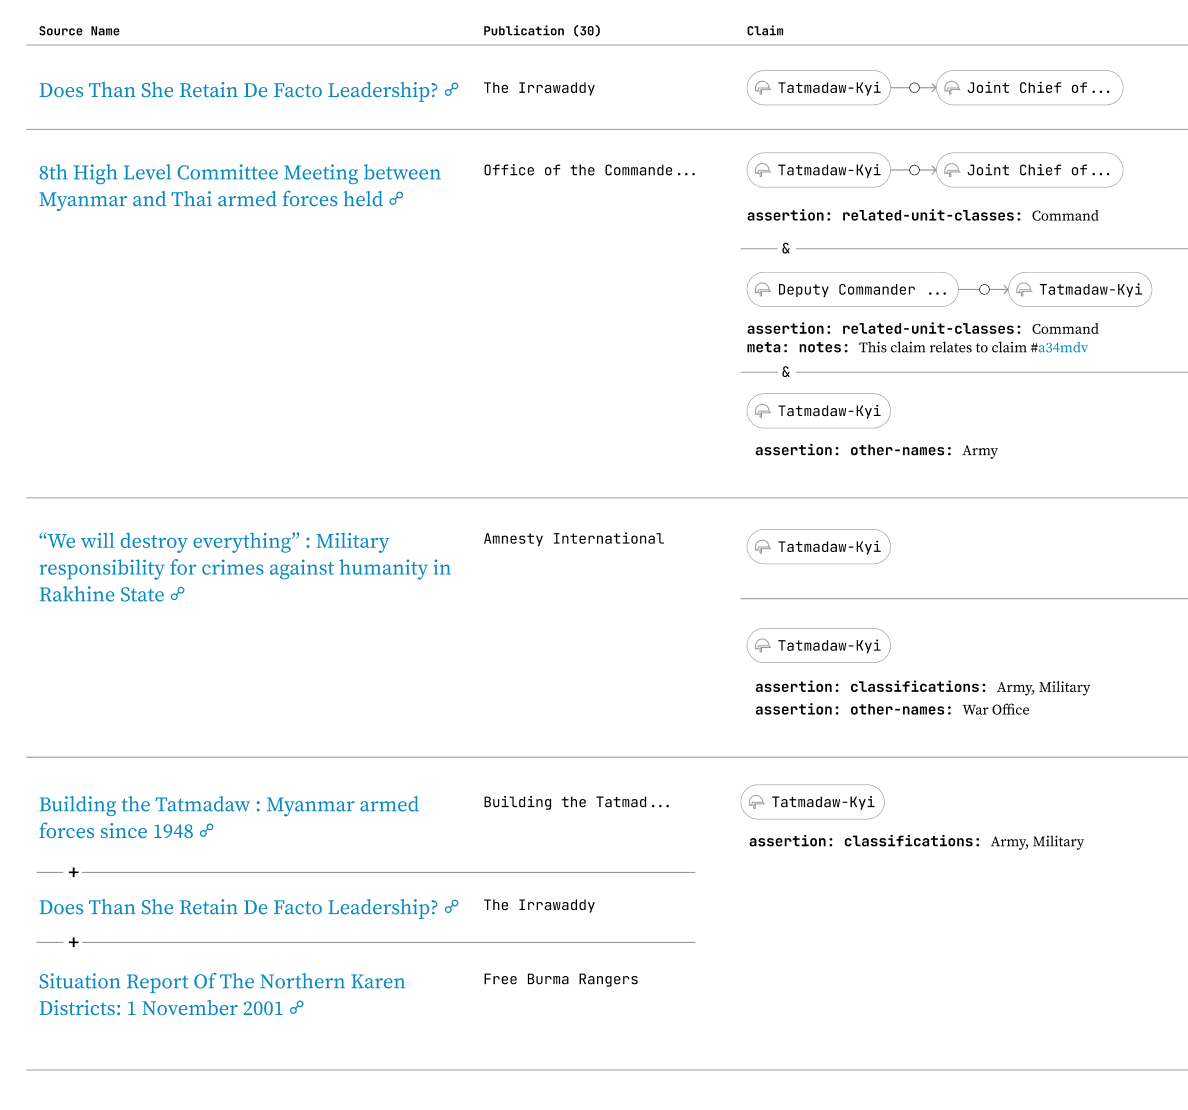
A visual representation of the model of a claim — including source, publisher, and the individual assertion (piece of data) it created.
13 A row of data in a spreadsheet, a JSON object, or an SQL table — many traditional data systems push data modeling into creating records and conflating data.
14 A claim is the intersection of assertions and the sources which made them. A claim asserts a part of a record — a part which is used in analysis later.
Problem • 3Retaining Precise Sourcing
Due to the goals of the project and the hopes that this information might some day be used in courts of law, the research team must record and archive the sources from which information was derived, so as to ensure they can be recalled at any point. SFM is in many ways a data aggregator — compiling information from many different sources into machine–readable and analyzable data. It is imperative that both upon entry and ingestion, data is stored at the highest fidelity. This way, it is always possible to show which sources claimed which assertion, and how this was used in analysis. Storing data at the highest complexity of information and then transforming it into reductions poses both workflow and technological challenges, but pays off in the lack of data loss. SFM should be able to explain not only how analysis was made, but which sources were used in the analysis, and which sources were used in which part of the analysis.
This means that SFM can not use the more common data model of a record13, with the sources used to create the record combined and listed at the bottom. Each individual claim14 must be stored separately. Relational Data makes this difficult, as it is optimized for storing records. Retaining sourcing data on assertions requires splitting information into finer pieces. RDF, Knowledge Graphs, and the Semantic web are superior solutions for this problem, and Clojure Datalog Databases are heavily inspired by them.
Conclusion & Learnings
introduction • process • unique problems • learnings
DOT • STUDIO and SFM’s ongoing collaboration continues to be a fruitful learning process for both organizations. In 2023, it was able to create:
- A new data format to track a novel research methodology,
- A suite of tools to help the research team validate and analyze this data in real time,
- And a usable public product for a specific dataset: the Tatmadaw in Myanmar.
We continue to develop the tooling, and plan on releasing more tools in the future, diving even deeper into graphs and their analysis.
Working directly together with the research team in tight feedback loops paid off. We were able to iterate quickly, prototype ideas, and develop a novel data model. Datomic, DataScript, and Datalog proved invaluable to flexibly think about this model and write deeply linked queries. It would not have been possible in an RDMS to work as flexibly or quickly, as much more application code would have been written. Bidirectional data transformations and queries were a huge help in modeling data.
We also learned that the graph datatype is endlessly complex. Things that seem easy increase dramatically when there are cycles in the data, or attempting to display them hierarchically. The opportunities for analysis, however, grow enormously, as well as being able to set a strong analytical foundation for how facts are derived.
Of the collaboration, Tom Longley – SFMs Deputy Director – says: “The technical challenge of working with a tapestry of rich open source material about security and defence forces is huge. We had already spent a number of years developing our research process, data modelling, tooling, and approach to geospatial information, and chose DOT • STUDIO to work with us to take these ideas further. We knew we’d made the right decision to work with Niko and DOT • STUDIO early on when Niko quickly solved the issue of how to show us dynamic command chains, taking our thinking about time-bound graphs and turning it into a usable application. The methodological and technical improvements that come from this great collaboration lay terrific foundations for our future work in the service of human rights and accountability.”
As an organization, we feel confident that using our time–based Datalog data model has applications all over the Human Rights and NGO space. Most documentation groups, from our experience, are only recording a fraction of what they could be, and we sincerely believe creating simple tools and methodologies for data collection and analysis is worthwhile for NGOs. We plan to write more specifically about the data model. A deep, more technical documentation published by SFM can be found here. Until then, please reach out to us with any questions — we love to talk data.
Published on 2024-11-28.
Good-Bye!